How to Read Crypto Price Charts
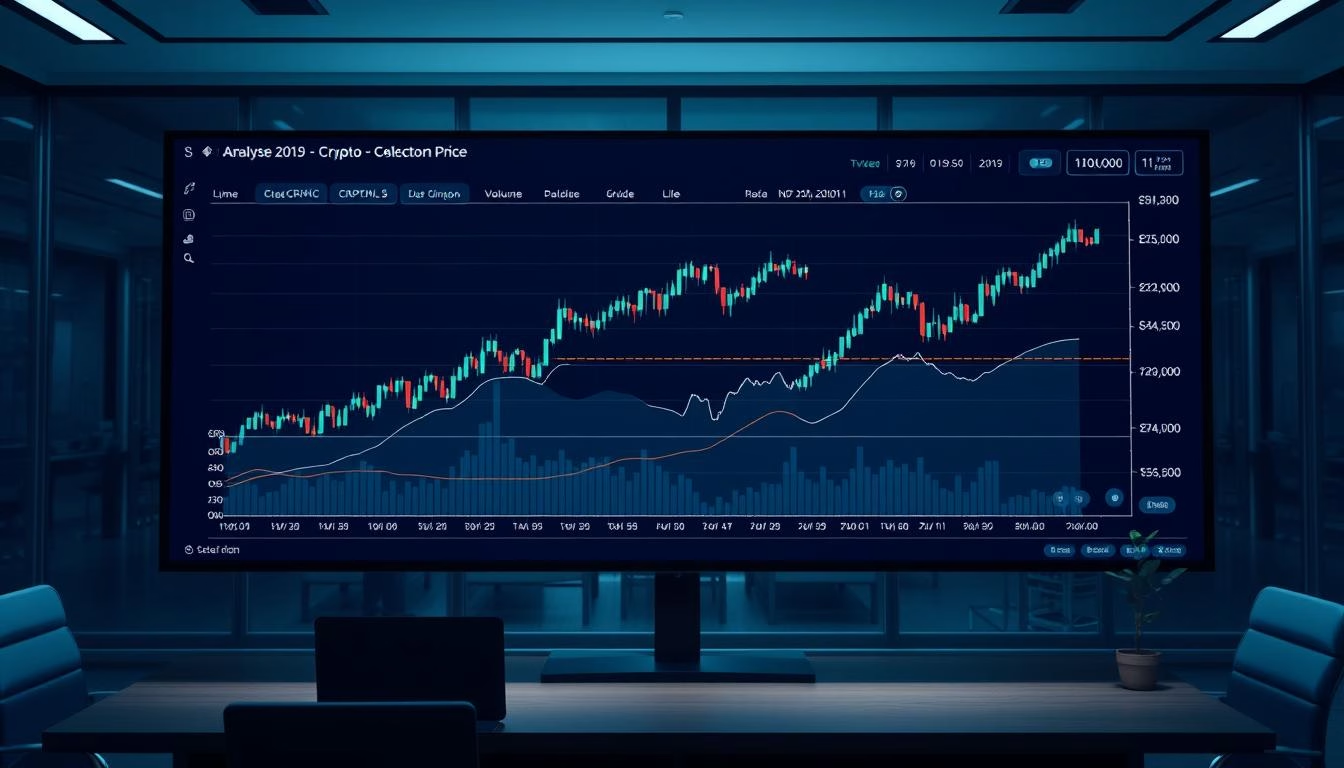
Ever wondered if you can really handle the ups and downs of cryptocurrency with crypto charts? Learning to read these charts is more than a skill; it’s crucial for smart trading. They show how prices change, helping traders see trends and predict the future.
This section will show why interactive crypto charts are key and how real-time data helps understand the market. As the crypto world changes fast, knowing how to use these charts can make all the difference. Let’s look at what makes these tools so important.
Understanding the Basics of Crypto Charts
Crypto charts are key for traders and investors in the crypto world. They show price changes over time, helping with better choices. There are many types of charts, each giving different insights into market trends.
Line charts are simple, showing price trends with lines. They’re good for seeing overall trends but miss the small price changes. On the other hand, candlestick charts give a detailed view. They show opening, closing, high, and low prices in set time frames. This helps traders understand market feelings better.
Bar charts are another popular choice. Like candlestick charts, they show price changes over time with vertical bars. Knowing the differences between these charts is important for good analysis.
Historical crypto charts are crucial for seeing long-term trends and patterns. They track prices over long periods, giving context for today’s market. By looking at historical data, traders can find support and resistance levels, helping shape their strategies.
In short, knowing about different crypto chart types and how to use them is essential. Choosing the right chart can improve analysis and lead to better trading decisions.
Key Components of Crypto Charts
Understanding crypto price charts is key for trading success. The price axes show a cryptocurrency’s value over time. This time can range from minutes to years. Knowing these parts helps traders spot market trends better.
On crypto charts, you’ll see high, low, open, close, and volume. Each is important for understanding market mood. High and low prices show the range in a time frame. Open and close prices show where the price started and ended. Volume tells you how much was traded, showing market activity and liquidity.
Advanced crypto charts add more with indicators and overlays like moving averages and Fibonacci retracements. These tools help spot patterns and predict price moves. Learning these skills helps traders handle the cryptocurrency market’s complexity.
Technical Analysis Tools for Trading
Traders use many tools to understand crypto price charts better. These tools help spot trends, reversals, and the best times to buy or sell. Popular tools include Moving Averages, the Relative Strength Index (RSI), MACD, and Bollinger Bands.
Moving Averages smooth out price data over time. This helps traders see trends and make decisions based on past data. The RSI shows how fast and how much prices change, helping spot when prices are too high or too low. MACD shows the relationship between two moving averages, acting as a momentum indicator. Bollinger Bands show price volatility and can signal when prices might break out.
Real-time cryptocurrency charts are key for using these tools well. They give the latest market data, helping traders stay updated. With these tools and real-time data, traders can make better choices. This can lead to more success in the crypto market.
Reading Price Movements
Learning to read price movements on crypto charts is key for smart trading. Patterns like head and shoulders, flags, and triangles show up often. Each pattern hints at what might happen next in the market.
Trading volume is closely tied to price movements. When price goes up and volume rises, it’s a strong sign. But if price goes up but volume falls, it might mean the move isn’t solid. Knowing this helps traders understand trends better.
Volatility is crucial for trading strategies. It offers chances for profit but also increases risks. By studying past data and making predictions, traders can better handle these ups and downs. Using this info with technical indicators can make a trading plan strong.
To learn more about reading price movements, check out how to read a crypto chart. This guide provides great tips on different chart types and their use in trading.
Tips for Effective Chart Analysis
Effective chart analysis is key for smart trading in the crypto market. Keeping a trading journal is a great tip. It helps you track your thoughts and learn from your trades. This way, you can spot what works and improve your strategy.
Interactive crypto charts are also helpful. They let you change timeframes and indicators easily. This makes analysis more personal. Plus, looking at different charts together gives a clearer view of market trends.
Staying current with market news is also important. News on regulations, tech, or the economy can change prices fast. By using these tips, traders can get better at analyzing charts. They become more confident in their trading, ready to handle the crypto market’s challenges.



0 Comments